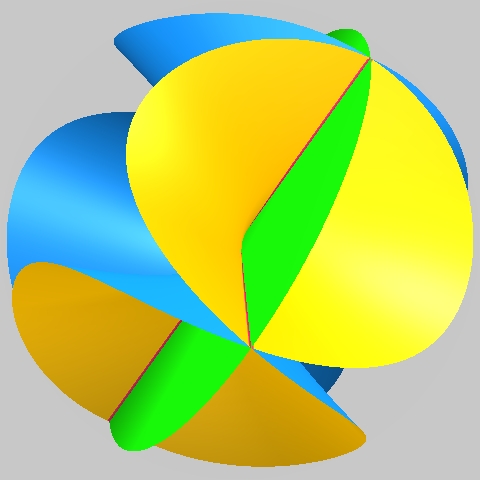
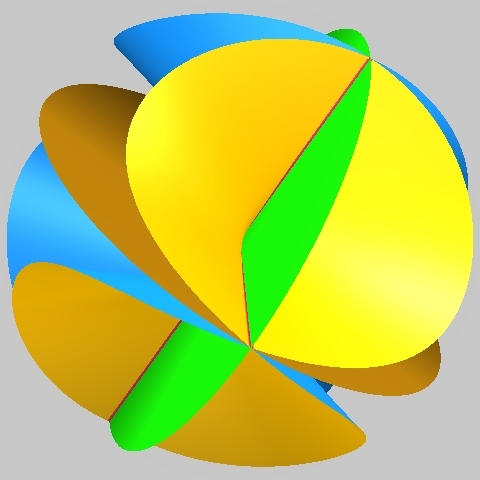
with Hypersurface of Maximal Contact (green)
and Descent in Dimension

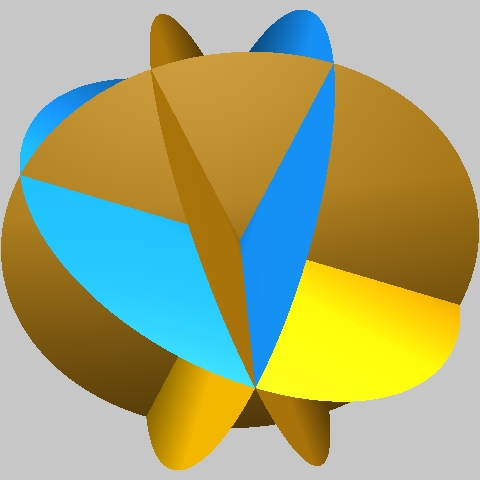
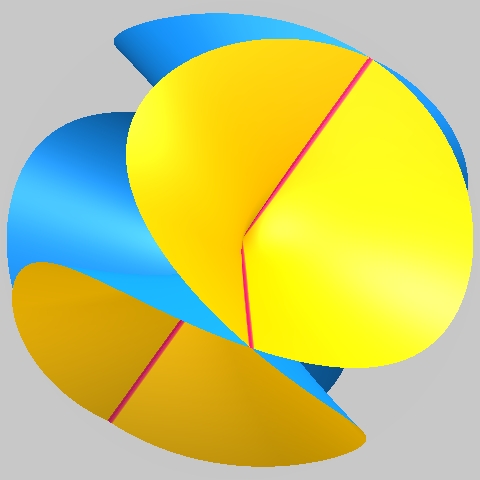
| Original Singularity V(z2-x2y2) | |
|
| Original Singularity with Hypersurface of Maximal Contact (green) and Descent in Dimension |
|
|
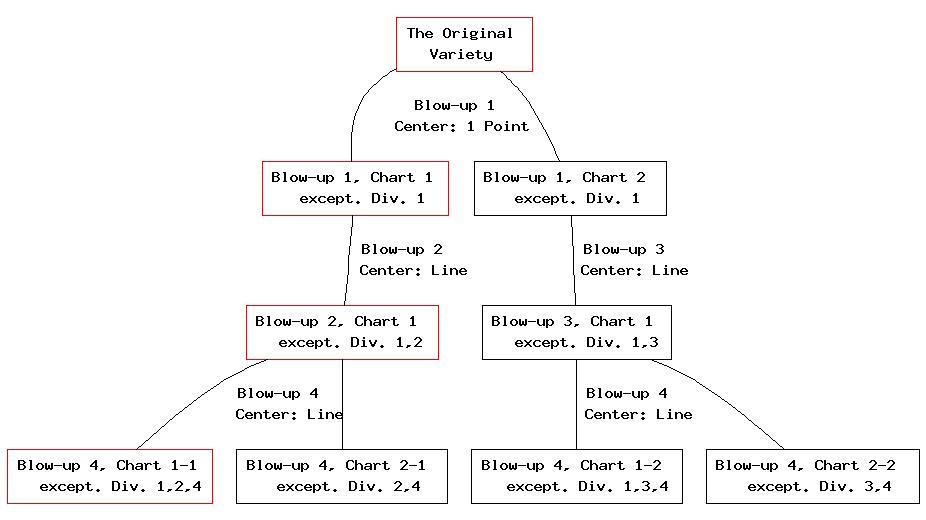
| chosen center: | point (0,0,0) | |
| After First Blow-Up (Blow-up 1, Chart 1) | |
|
| chosen center: | red line | |
| After Second Blow-Up (Blow-up 2, Chart 1) | |
|
| chosen center: | line | |
| After Subsequent Blow-Up (Blow-up 4, Chart 1-1) | |
resolution finished |